📈 Prometheus metrics
LiteLLM Exposes a /metrics endpoint for Prometheus to Poll
Quick Start
If you're using the LiteLLM CLI with litellm --config proxy_config.yaml then you need to pip install prometheus_client==0.20.0. This is already pre-installed on the litellm Docker image
Add this to your proxy config.yaml
model_list:
  - model_name: gpt-4o
    litellm_params:
      model: gpt-4o
litellm_settings:
  callbacks:
    - prometheus
Start the proxy
litellm --config config.yaml --debug
Test Request
curl --location 'http://0.0.0.0:4000/chat/completions' \
    --header 'Content-Type: application/json' \
    --data '{
    "model": "gpt-4o",
    "messages": [
        {
        "role": "user",
        "content": "what llm are you"
        }
    ]
}'
View Metrics on /metrics, Visit http://localhost:4000/metrics
http://localhost:4000/metrics

# <proxy_base_url>/metrics
Multiple Workers
When using LiteLLM with multiple workers, you need to set the PROMETHEUS_MULTIPROC_DIR environment variable to enable aggregated metric collection across worker processes.
export PROMETHEUS_MULTIPROC_DIR="/prometheus_multiproc"
This directory is used by the Prometheus client library to store metric files that can be shared across multiple worker processes. Make sure the directory exists and is writable by your LiteLLM process.
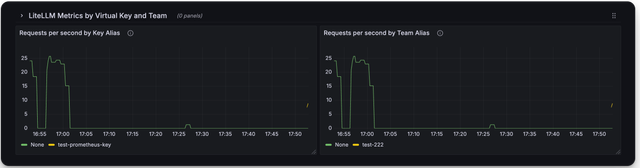
Virtual Keys, Teams, Internal Users
Use this for for tracking per user, key, team, etc.
| Metric Name | Description |
|---|---|
litellm_spend_metric | Total Spend, per "end_user", "hashed_api_key", "api_key_alias", "model", "team", "team_alias", "user" |
litellm_total_tokens_metric | input + output tokens per "end_user", "hashed_api_key", "api_key_alias", "requested_model", "team", "team_alias", "user", "model" |
litellm_input_tokens_metric | input tokens per "end_user", "hashed_api_key", "api_key_alias", "requested_model", "team", "team_alias", "user", "model" |
litellm_output_tokens_metric | output tokens per "end_user", "hashed_api_key", "api_key_alias", "requested_model", "team", "team_alias", "user", "model" |
Team - Budget
| Metric Name | Description |
|---|---|
litellm_team_max_budget_metric | Max Budget for Team Labels: "team", "team_alias" |
litellm_remaining_team_budget_metric | Remaining Budget for Team (A team created on LiteLLM) Labels: "team", "team_alias" |
litellm_team_budget_remaining_hours_metric | Hours before the team budget is reset Labels: "team", "team_alias" |
Virtual Key - Budget
| Metric Name | Description |
|---|---|
litellm_api_key_max_budget_metric | Max Budget for API Key Labels: "hashed_api_key", "api_key_alias" |
litellm_remaining_api_key_budget_metric | Remaining Budget for API Key (A key Created on LiteLLM) Labels: "hashed_api_key", "api_key_alias" |
litellm_api_key_budget_remaining_hours_metric | Hours before the API Key budget is reset Labels: "hashed_api_key", "api_key_alias" |
Virtual Key - Rate Limit
| Metric Name | Description |
|---|---|
litellm_remaining_api_key_requests_for_model | Remaining Requests for a LiteLLM virtual API key, only if a model-specific rate limit (rpm) has been set for that virtual key. Labels: "hashed_api_key", "api_key_alias", "model" |
litellm_remaining_api_key_tokens_for_model | Remaining Tokens for a LiteLLM virtual API key, only if a model-specific token limit (tpm) has been set for that virtual key. Labels: "hashed_api_key", "api_key_alias", "model" |
Initialize Budget Metrics on Startup
If you want litellm to emit the budget metrics for all keys, teams irrespective of whether they are getting requests or not, set prometheus_initialize_budget_metrics to true in the config.yaml
How this works:
- If the
prometheus_initialize_budget_metricsis set totrue- Every 5 minutes litellm runs a cron job to read all keys, teams from the database
- It then emits the budget metrics for each key, team
- This is used to populate the budget metrics on the
/metricsendpoint
litellm_settings:
  callbacks: ["prometheus"]
  prometheus_initialize_budget_metrics: true
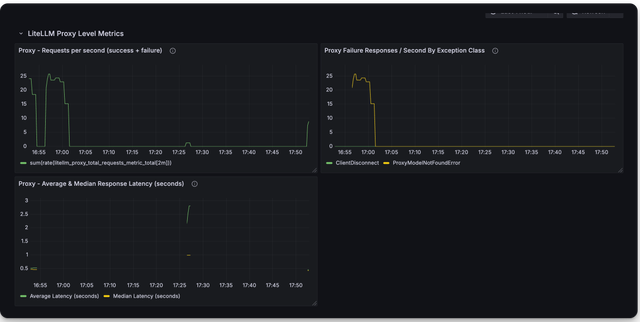
Proxy Level Tracking Metrics
Use this to track overall LiteLLM Proxy usage.
- Track Actual traffic rate to proxy
- Number of client side requests and failures for requests made to proxy
| Metric Name | Description |
|---|---|
litellm_proxy_failed_requests_metric | Total number of failed responses from proxy - the client did not get a success response from litellm proxy. Labels: "end_user", "hashed_api_key", "api_key_alias", "requested_model", "team", "team_alias", "user", "user_email", "exception_status", "exception_class", "route", "model_id" |
litellm_proxy_total_requests_metric | Total number of requests made to the proxy server - track number of client side requests. Labels: "end_user", "hashed_api_key", "api_key_alias", "requested_model", "team", "team_alias", "user", "status_code", "user_email", "route", "model_id" |
Callback Logging Metrics
Monitor failures while shipping logs to downstream callbacks like s3_v3 cold storage
| Metric Name | Description |
|---|---|
litellm_callback_logging_failures_metric | Total number of failed attempts to emit logs to a configured callback. Labels: "callback_name". Use this to alert on callback delivery issues such as repeated failures when writing to s3_v3, langfuse, or langfuse_otel and other otel providers |
Supported Callbacks:
S3Logger- S3 v2 cold storage failureslangfuse- Langfuse logging failuresotel- OpenTelemetry logging failures
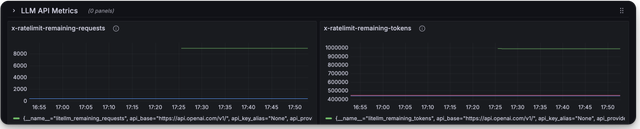
LLM Provider Metrics
Use this for LLM API Error monitoring and tracking remaining rate limits and token limits
Labels Tracked
| Label | Description |
|---|---|
| litellm_model_name | The name of the LLM model used by LiteLLM |
| requested_model | The model sent in the request |
| model_id | The model_id of the deployment. Autogenerated by LiteLLM, each deployment has a unique model_id |
| api_base | The API Base of the deployment |
| api_provider | The LLM API provider, used for the provider. Example (azure, openai, vertex_ai) |
| hashed_api_key | The hashed api key of the request |
| api_key_alias | The alias of the api key used |
| team | The team of the request |
| team_alias | The alias of the team used |
| exception_status | The status of the exception, if any |
| exception_class | The class of the exception, if any |
Success and Failure
| Metric Name | Description |
|---|---|
litellm_deployment_success_responses | Total number of successful LLM API calls for deployment. Labels: "requested_model", "litellm_model_name", "model_id", "api_base", "api_provider", "hashed_api_key", "api_key_alias", "team", "team_alias" |
litellm_deployment_failure_responses | Total number of failed LLM API calls for a specific LLM deployment. Labels: "requested_model", "litellm_model_name", "model_id", "api_base", "api_provider", "hashed_api_key", "api_key_alias", "team", "team_alias", "exception_status", "exception_class" |
litellm_deployment_total_requests | Total number of LLM API calls for deployment - success + failure. Labels: "requested_model", "litellm_model_name", "model_id", "api_base", "api_provider", "hashed_api_key", "api_key_alias", "team", "team_alias" |
Remaining Requests and Tokens
| Metric Name | Description |
|---|---|
litellm_remaining_requests_metric | Track x-ratelimit-remaining-requests returned from LLM API Deployment. Labels: "model_group", "api_provider", "api_base", "litellm_model_name", "hashed_api_key", "api_key_alias" |
litellm_remaining_tokens_metric | Track x-ratelimit-remaining-tokens return from LLM API Deployment. Labels: "model_group", "api_provider", "api_base", "litellm_model_name", "hashed_api_key", "api_key_alias" |
Deployment State
| Metric Name | Description |
|---|---|
litellm_deployment_state | The state of the deployment: 0 = healthy, 1 = partial outage, 2 = complete outage. Labels: "litellm_model_name", "model_id", "api_base", "api_provider" |
litellm_deployment_latency_per_output_token | Latency per output token for deployment. Labels: "litellm_model_name", "model_id", "api_base", "api_provider", "hashed_api_key", "api_key_alias", "team", "team_alias" |
Fallback (Failover) Metrics
| Metric Name | Description |
|---|---|
litellm_deployment_cooled_down | Number of times a deployment has been cooled down by LiteLLM load balancing logic. Labels: "litellm_model_name", "model_id", "api_base", "api_provider" |
litellm_deployment_successful_fallbacks | Number of successful fallback requests from primary model -> fallback model. Labels: "requested_model", "fallback_model", "hashed_api_key", "api_key_alias", "team", "team_alias", "exception_status", "exception_class" |
litellm_deployment_failed_fallbacks | Number of failed fallback requests from primary model -> fallback model. Labels: "requested_model", "fallback_model", "hashed_api_key", "api_key_alias", "team", "team_alias", "exception_status", "exception_class" |
Request Counting Metrics
| Metric Name | Description |
|---|---|
litellm_requests_metric | Total number of requests tracked per endpoint. Labels: "end_user", "hashed_api_key", "api_key_alias", "model", "team", "team_alias", "user", "user_email" |
Request Latency Metrics
| Metric Name | Description |
|---|---|
litellm_request_total_latency_metric | Total latency (seconds) for a request to LiteLLM Proxy Server - tracked for labels "end_user", "hashed_api_key", "api_key_alias", "requested_model", "team", "team_alias", "user", "model", "model_id" |
litellm_overhead_latency_metric | Latency overhead (seconds) added by LiteLLM processing - tracked for labels "model_group", "api_provider", "api_base", "litellm_model_name", "hashed_api_key", "api_key_alias" |
litellm_llm_api_latency_metric | Latency (seconds) for just the LLM API call - tracked for labels "model", "hashed_api_key", "api_key_alias", "team", "team_alias", "requested_model", "end_user", "user" |
litellm_llm_api_time_to_first_token_metric | Time to first token for LLM API call - tracked for labels model, hashed_api_key, api_key_alias, team, team_alias, requested_model, end_user, user, model_id [Note: only emitted for streaming requests] |
Tracking end_user on Prometheus
By default LiteLLM does not track end_user on Prometheus. This is done to reduce the cardinality of the metrics from LiteLLM Proxy.
If you want to track end_user on Prometheus, you can do the following:
litellm_settings:
  callbacks: ["prometheus"]
  enable_end_user_cost_tracking_prometheus_only: true
[BETA] Custom Metrics
Track custom metrics on prometheus on all events mentioned above.
Custom Metadata Labels
- Define the custom metadata labels in the
config.yaml
model_list:
  - model_name: openai/gpt-4o
    litellm_params:
      model: openai/gpt-4o
      api_key: os.environ/OPENAI_API_KEY

litellm_settings:
  callbacks: ["prometheus"]
  custom_prometheus_metadata_labels: ["metadata.foo", "metadata.bar"]
- Make a request with the custom metadata labels
- Curl Request
- on Key
- on Team
curl -L -X POST 'http://0.0.0.0:4000/v1/chat/completions' \
-H 'Content-Type: application/json' \
-H 'Authorization: Bearer <LITELLM_API_KEY>' \
-d '{
    "model": "openai/gpt-4o",
    "messages": [
      {
        "role": "user",
        "content": [
          {
            "type": "text",
            "text": "What's in this image?"
          }
        ]
      }
    ],
    "max_tokens": 300,
    "metadata": {
        "foo": "hello world"
    }
}'
curl -L -X POST 'http://0.0.0.0:4000/key/generate' \
-H 'Authorization: Bearer sk-1234' \
-H 'Content-Type: application/json' \
-d '{
    "metadata": {
        "foo": "hello world"
    }
}'
curl -L -X POST 'http://0.0.0.0:4000/team/new' \
-H 'Authorization: Bearer sk-1234' \
-H 'Content-Type: application/json' \
-d '{
    "metadata": {
        "foo": "hello world"
    }
}'
- Check your
/metricsendpoint for the custom metrics
... "metadata_foo": "hello world" ...
Custom Tags
Track specific tags as prometheus labels for better filtering and monitoring.
- Define the custom tags in the
config.yaml
model_list:
  - model_name: openai/gpt-4o
    litellm_params:
      model: openai/gpt-4o
      api_key: os.environ/OPENAI_API_KEY

litellm_settings:
  callbacks: ["prometheus"]
  custom_prometheus_metadata_labels: ["metadata.foo", "metadata.bar"]
  custom_prometheus_tags:
    - "prod"
    - "staging"
    - "batch-job"
    - "User-Agent: RooCode/*"
    - "User-Agent: claude-cli/*"
- Make a request with tags
curl -L -X POST 'http://0.0.0.0:4000/v1/chat/completions' \
-H 'Content-Type: application/json' \
-H 'Authorization: Bearer <LITELLM_API_KEY>' \
-d '{
    "model": "openai/gpt-4o",
    "messages": [
      {
        "role": "user",
        "content": [
          {
            "type": "text",
            "text": "What's in this image?"
          }
        ]
      }
    ],
    "max_tokens": 300,
    "metadata": {
        "tags": ["prod", "user-facing"]
    }
}'
- Check your
/metricsendpoint for the custom tag metrics
... "tag_prod": "true", "tag_staging": "false", "tag_batch_job": "false" ...
How Custom Tags Work:
- Each configured tag becomes a boolean label in prometheus metrics
- If a tag matches (exact or wildcard), the label value is
"true", otherwise"false" - Tag names are sanitized for prometheus compatibility (e.g.,
"batch-job"becomes"tag_batch_job") - Wildcard patterns supported using
*(e.g.,"User-Agent: RooCode/*"matches"User-Agent: RooCode/1.0.0")
Example with wildcards:
litellm_settings:
  callbacks: ["prometheus"]
  custom_prometheus_tags:
    - "User-Agent: RooCode/*"
    - "User-Agent: claude-cli/*"
Use Cases:
- Environment tracking (
prod,staging,dev) - Request type classification (
batch-job,user-facing,background) - Feature flags (
new-feature,beta-users) - Team or service identification (
team-a,service-xyz) - User-Agent Tracking - use this to track how much Roo Code, Claude Code, Gemini CLI are used (
User-Agent: RooCode/*,User-Agent: claude-cli/*,User-Agent: gemini-cli/*)
Configuring Metrics and Labels
You can selectively enable specific metrics and control which labels are included to optimize performance and reduce cardinality.
Enable Specific Metrics and Labels
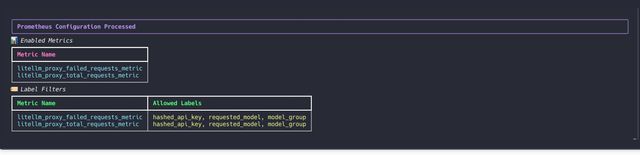
Configure which metrics to emit by specifying them in prometheus_metrics_config. Each configuration group needs a group name (for organization) and a list of metrics to enable. You can optionally include a list of include_labels to filter the labels for the metrics.
model_list:
 - model_name: gpt-4o
    litellm_params:
      model: gpt-4o

litellm_settings:
  callbacks: ["prometheus"]
  prometheus_metrics_config:
    # High-cardinality metrics with minimal labels
    - group: "proxy_metrics"
      metrics:
        - "litellm_proxy_total_requests_metric"
        - "litellm_proxy_failed_requests_metric"
      include_labels:
        - "hashed_api_key"
        - "requested_model"
        - "model_group"
On starting up LiteLLM if your metrics were correctly configured, you should see the following on your container logs
Filter Labels Per Metric
Control which labels are included for each metric to reduce cardinality:
litellm_settings:
  callbacks: ["prometheus"]
  prometheus_metrics_config:
    - group: "token_consumption"
      metrics:
        - "litellm_input_tokens_metric"
        - "litellm_output_tokens_metric"
        - "litellm_total_tokens_metric"
      include_labels:
        - "model"
        - "team"
        - "hashed_api_key"
    - group: "request_tracking"
      metrics:
        - "litellm_proxy_total_requests_metric"
      include_labels:
        - "status_code"
        - "requested_model"
Advanced Configuration
You can create multiple configuration groups with different label sets:
litellm_settings:
  callbacks: ["prometheus"]
  prometheus_metrics_config:
    # High-cardinality metrics with minimal labels
    - group: "deployment_health"
      metrics:
        - "litellm_deployment_success_responses"
        - "litellm_deployment_failure_responses"
      include_labels:
        - "api_provider"
        - "requested_model"

    # Budget metrics with full label set
    - group: "budget_tracking"
      metrics:
        - "litellm_remaining_team_budget_metric"
      include_labels:
        - "team"
        - "team_alias"
        - "hashed_api_key"
        - "api_key_alias"
        - "model"
        - "end_user"

    # Latency metrics with performance-focused labels
    - group: "performance"
      metrics:
        - "litellm_request_total_latency_metric"
        - "litellm_llm_api_latency_metric"
      include_labels:
        - "model"
        - "api_provider"
        - "requested_model"
Configuration Structure:
group: A descriptive name for organizing related metricsmetrics: List of metric names to include in this groupinclude_labels: (Optional) List of labels to include for these metrics
Default Behavior: If no prometheus_metrics_config is specified, all metrics are enabled with their default labels (backward compatible).
Monitor System Health
To monitor the health of litellm adjacent services (redis / postgres), do:
model_list:
 - model_name: gpt-4o
    litellm_params:
      model: gpt-4o
litellm_settings:
  service_callback: ["prometheus_system"]
| Metric Name | Description |
|---|---|
litellm_redis_latency | histogram latency for redis calls |
litellm_redis_fails | Number of failed redis calls |
litellm_self_latency | Histogram latency for successful litellm api call |
DB Transaction Queue Health Metrics
Use these metrics to monitor the health of the DB Transaction Queue. Eg. Monitoring the size of the in-memory and redis buffers.
| Metric Name | Description | Storage Type |
|---|---|---|
litellm_pod_lock_manager_size | Indicates which pod has the lock to write updates to the database. | Redis |
litellm_in_memory_daily_spend_update_queue_size | Number of items in the in-memory daily spend update queue. These are the aggregate spend logs for each user. | In-Memory |
litellm_redis_daily_spend_update_queue_size | Number of items in the Redis daily spend update queue. These are the aggregate spend logs for each user. | Redis |
litellm_in_memory_spend_update_queue_size | In-memory aggregate spend values for keys, users, teams, team members, etc. | In-Memory |
litellm_redis_spend_update_queue_size | Redis aggregate spend values for keys, users, teams, etc. | Redis |
🔥 LiteLLM Maintained Grafana Dashboards
Link to Grafana Dashboards maintained by LiteLLM
https://github.com/BerriAI/litellm/tree/main/cookbook/litellm_proxy_server/grafana_dashboard
Here is a screenshot of the metrics you can monitor with the LiteLLM Grafana Dashboard
Deprecated Metrics
| Metric Name | Description |
|---|---|
litellm_llm_api_failed_requests_metric | deprecated use litellm_proxy_failed_requests_metric |
Add authentication on /metrics endpoint
By default /metrics endpoint is unauthenticated.
You can opt into running litellm authentication on the /metrics endpoint by setting the following on the config
litellm_settings:
  require_auth_for_metrics_endpoint: true
FAQ
What are _created vs. _total metrics?
_createdmetrics are metrics that are created when the proxy starts_totalmetrics are metrics that are incremented for each request
You should consume the _total metrics for your counting purposes